In this post I have explained how to build a very simple GSR sensor circuit using just a couple of transistors and a few other passive components.
A GSR (Galvanic Skin Resistance) sensor, also known as a skin conductance or electrodermal activity sensor, measures the electrical conductance of the skin, which changes in response to physiological or emotional stimuli.
It is frequently used to detect stress or emotional arousal by measuring fluctuations in skin conductance.
Introduction
We know that smoking is a cause of cancer; however, there exist numerous heavy smokers who will live a long life without ever developing lung cancer.
Specific dietary patterns can lead to heart disease, but there isn't a singular diet that guarantees heart disease or complete immunity from it.
The severity of disease can vary significantly among individuals; a certain illness that might cause mild symptoms in one person could be fatal in another. The reasons behind this discrepant response are not always clear.
Over the last century, there has been a consistent decrease in communicable diseases such as flu or polio, which has been paralleled by a substantial rise in disorders related to stress, including high blood pressure, ulcers, and heart disease.
Depending on the source of information, stress is considered a significant factor, if not the fundamental cause, of anywhere from 50% to 80% of ailments.
Some individuals argue that stress is at least a contributing factor in all cases.
What Researchers Say
Certain researchers hold the belief that following a period of stress, the body doesn't fully return to its baseline state, causing certain organs to eventually become either overly active or insufficiently functional.
The cumulative impact of these changes can lead to severe outcomes. For instance, ulcers may develop due to the improper secretion of stomach acid, which gradually erodes the stomach lining.
Despite the vastly different modern environment we have constructed for ourselves to inhabit, our bodies continue to function at a primitive level similar to that of early humans.
Unfortunately, our innate survival mechanisms have become detrimental to us.
The goal of managing stress, through various methods, is to prevent the inappropriate triggering of the 'fight or flight' response.
However, it also aims to preserve the body's ability to activate this response if we were to encounter a genuine life-threatening situation.
Basic GSR Sensor Circuit Diagram and Description


There exists a robust relationship between skin resistance and states of arousal or relaxation.
Elevated resistance corresponds to a more relaxed state, while reduced resistance indicates tension. The Galvanic Skin Resistance (GSR) sensor quantifies skin resistance and provides feedback, either through varying pitch tones or the movement of a meter needle.
Fluctuations in resistance stem from variations in electrolyte concentration within the deeper layers of skin tissue (dermis).
Contrary to common perception, perspiration minimally affects readings; a damp or dry palm can display both high and low resistance.
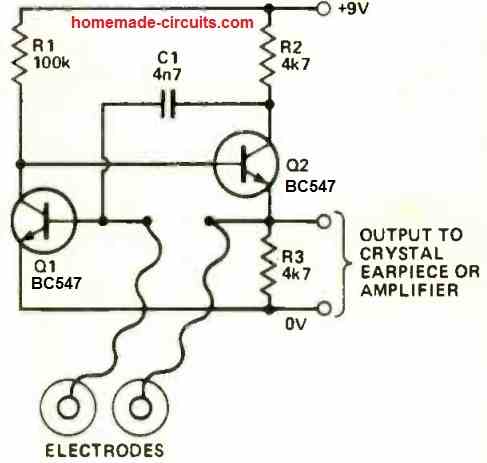
The fundamental GSR monitoring circuit, which you can assemble using your readily available components, is depicted in the above figure.
The circuit functions as an oscillator, generating output frequency in accordance with the resistance between the two electrodes.
How to Use the Basic GSR Sensor Circuit
The electrodes are to be positioned on the palms of your hands – one electrode per palm.
While obtaining satisfactory GSR responses from the fingertips is feasible, the movement of fingers can alter blood flow across knuckles, requiring stillness, which might hinder relaxation attempts.
Optimal outcomes can be achieved with proper electrodes and conductive gel, although these items might not be readily accessible. Nevertheless, measurements can be conducted using only exposed wire ends affixed to your palms with tape.
Once the electrodes are connected, you'll likely perceive a varying pitch tone upon hand movement.
Secure the tape firmly and position your hands, palms upward, alongside your body. Take a deep breath – inhale deeply, then exhale.
Shortly after exhaling, a distinct pitch rise should become noticeable.
Engaging in a series of deep breaths will likely lead to a further increase in pitch. We tested this approach in our office and found it to be effective.
How to Build a GSR Meter Circuit
The complete schematic diagram of the basic GSR monitor circuit as shown below consists of an oscillator configuration where the frequency changes inversely concerning the resistance at the input terminals.

The output across R3 can be linked to either a crystal earpiece or an amplifier with a loudspeaker to generate an audible tone.
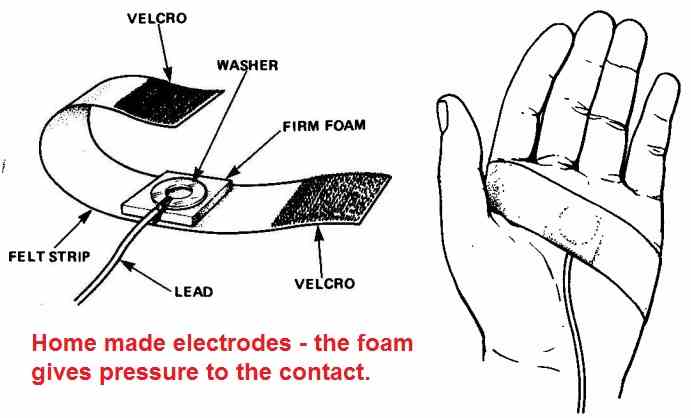
At its simplest, the electrodes might be the exposed tips of stranded wire affixed to your palms using adhesive tape. Optimal outcomes, however, can be achieved by soldering a large washer to each lead's end.
By utilizing a combination of felt, Velcro, foam rubber, and adhesive, you can craft a set of strap-on electrodes as shown in the following figure.

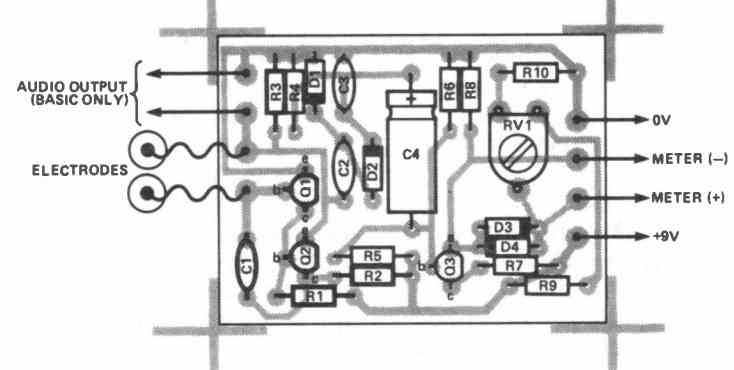
The next figure below displays the component layout. The circuit is powered by a 9V PP3 battery; employing a mains power supply could potentially be unsafe, so it's advised against.

The circuit's design was intended to operate effectively across a broad spectrum, accounting for possible variations in skin resistance among different individuals.
Roughly 90% of people will exhibit skin resistance ranging from 50k to 200k.
However, the monitor will be responsive to this range, albeit with a trade-off in sensitivity towards minor resistance fluctuations.
Determining whether the tone has escalated or diminished over a specific period can be challenging.
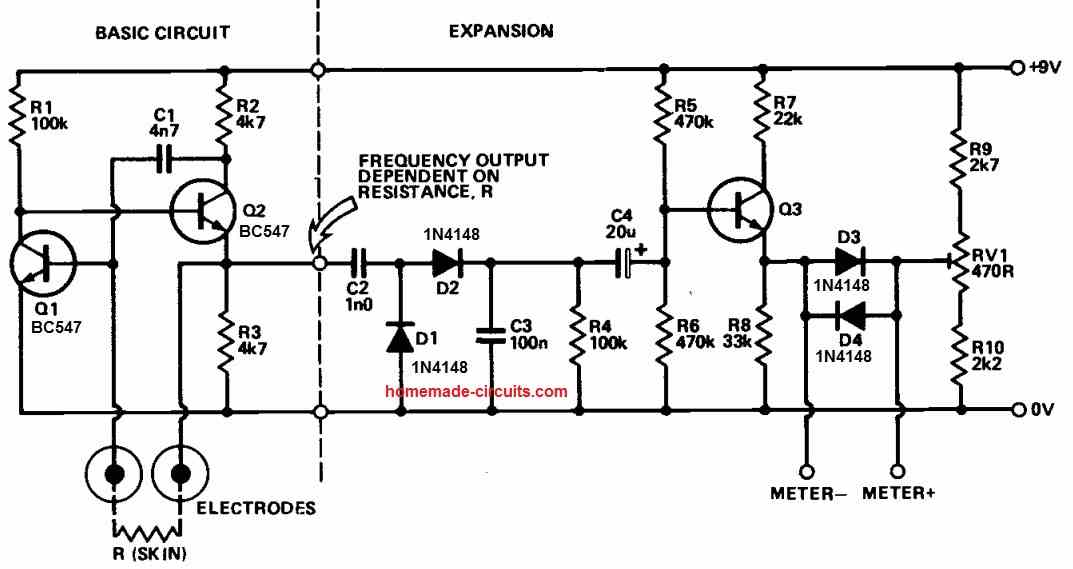
For the creation of a more sensitive and efficient monitor, the basic GSR meter circuit can be expanded as given above. Adequate space has been allotted for this expansion on the PCB.
The input from the electrodes continues to drive an oscillator, but the ensuing signal now undergoes processing to generate an output suitable for connection to a meter.
The circuit adapts to varying resistances while distinctly indicating alterations.
An analog multi-meter is the optimal choice for the display. It allows for quick assessment of whether the needle has shifted left or right.
Additionally, the instrument's sensitivity can be fine-tuned by selecting different meter ranges.
The 50µA range is suitable, as it clearly reveals minor modifications without causing the meter needle to go beyond the scale for significant variations.
How the Circuit Works
Q1 and Q2 (as illustrated in the above schematic) constitute an oscillator, the frequency of which relies on the resistance between the electrodes.
In the fundamental circuit configuration, biofeedback is acquired by monitoring the oscillator's output at the emitter of Q2.
In the expanded circuit arrangement, a non-linear charge pump circuit is formed by components C2, D1, D2, C3, and R4.
This circuit generates a voltage across R4 that correlates with the frequency of the oscillator.
The non-linear design of the charge pump allows it to work effectively across a diverse array of frequencies.
Its purpose is to indicate the percentage change in frequency rather than the specific frequency in Hz that has changed.
The arrangement of components R5, R6, R9, R10, and RV1 establishes a bridge configuration.
Q3 is integrated into the circuit to confer a high input resistance and low output resistance to one arm of the bridge.
R7 and R8 are meticulously chosen to cap the maximum output current at approximately 100 uA.
D3 and D4 provide additional protection to the meter in cases where an incorrect range setting is chosen.
Typically, the bridge is aligned to equilibrium by adjusting RV1 (technically, it is offset to yield a mid-scale reading on the meter, thus negating the necessity for a center-zero reference point).
By introducing a voltage to C4 from the charge pump, the bridge's equilibrium can be disrupted.
Fluctuations in the charge pump output voltage are duly reflected by the bridge's indication.
If the voltage remains constant, the bridge will realign to equilibrium after an interval of around twenty seconds.
As a result, the output exhibits remarkable sensitivity to shifts in skin resistance, and is capable of accommodating a wide spectrum of inputs without necessitating adjustments.
How to Setup
Temporarily link a 47k resistor between the two plugs of the electrodes. Set your meter to the 1 mA range and connect it to the terminal posts.
Now, power on the system. The meter's needle should show an approximate reading of 100uA.
If the needle attempts to move to the left, deactivate the monitor and confirm that the connections to the terminal posts are correctly oriented.
After around ten seconds, the needle will gradually return on its own to a lower reading. If it goes beyond the scale at this point, adjust RV1 to bring it back within range.
Once it stabilizes, fine-tune RV1 so that the meter reads slightly above zero.
Subsequently, switch to the 50µA range (or the nearest available range on your meter).
Use RV1 to attain a mid-scale reading and wait for about a minute to ensure the circuit has settled. Make further adjustments to RV1 if needed.
Now detach the meter, turn off the monitor, assemble the case, and you're prepared to initiate.
The circuit is equipped with components to shield the meter from overload.
Nevertheless, it's prudent to always shift to a less sensitive range whenever you power up the monitor (given a peak current of approximately 100µA) or make alterations to the electrodes.
During operation, a leftward movement of the meter needle corresponds to an increase in pitch on the fundamental or the basic GSR meter circuit (and vice versa).
How to Use the GSR Sensor Circuit
Apply a small amount of conductive gel onto your fingertip and use it to fill the recess on each electrode pad.
If you slightly bend your hand, you will observe a relatively motionless area on your palm – this area is the optimal placement for the pads (refer to the illustration depicting the palm of the hand).
Ensure that your hands are clean. For a thorough approach, gently rub your palms with a pumice stone to eliminate any loose dead cells.
Peel off the adhesive covering from the rim of the pads, then firmly affix them to your palms – one on each hand.
Locate a comfortable seating position and rest your hands with the palms facing inwards or upwards, avoiding pressure on the electrodes.
Discover a hand posture that feels natural and strain-free. Once the meter needle stabilizes, take a few deep breaths.
After a moment, you should notice the needle shifting to the left. Upon returning to normal breathing, it should move back towards the center.
A similar effect can be achieved by tensing your muscles – try this with your leg muscles – or by lightly biting your lip (avoid excessive pressure).
In each scenario, you'll observe a slight delay before the needle responds – typically a second or two after the stimulus.
This delay isn't a feature of the meter, but rather a characteristic of your body. It takes that brief period to react and generate a change in resistance.
Another observation is that the recovery process takes notably longer than the initial response. The needle swiftly moves to the left, but its return to the right is gradual.
Generating a change without any physical aids is nearly as simple – just concentrate on a troubling or exhilarating situation.
If you lack a vivid imagination, a real-life situation will likely induce a more substantial response than an imaginary one.
While experimenting with the GSR monitor, you might notice the needle shifting without a discernible cause.
Your body is continually influenced by its surroundings and reacts to stimuli that might escape your conscious awareness.
Interestingly, many individuals exhibit significant resistance fluctuations in reaction to traffic noise, even if they claim not to consciously perceive it!
Applications
Some of the main applications of the above GSR meter circuit which can be implemented by the user are I have explained below:
Promoting Relaxation
The GSR monitor serves as a valuable tool for managing stress, promoting relaxation, and enhancing meditation. Locate a peaceful environment where interruptions are unlikely.
Minimize exposure to traffic noise if feasible, and ensure you're not within sight of reminders about pending tasks.
Choose a comfortable chair to sit in (lying down might lead to drowsiness, which is not the intended outcome of this practice).
Remember, relaxation isn't an action you perform; it's a state you allow to unfold. Utilizing a meaningless word or mantra could facilitate this process.
Keep your eyes open, but avoid fixating on the meter needle. Instead, periodically acknowledge its presence.
Concentrating too intensely on it may cause the needle to sway to the left, disrupting the intended mood.
Over time, the needle should shift to the right; it might oscillate freely around the central position or slightly to the right of it.
Both outcomes indicate you're progressing positively. After ten or fifteen minutes, it's advisable to conclude the exercise.
Detecting Deception
Lie detection relies on the principle that a person's autonomic nervous system reacts more strongly when lying than when telling the truth.
Although a significant industry in the USA, this practice hasn't gained substantial traction here, fortunately.
Commercial lie detection tools, often referred to as 'polygraphs,' incorporate various biometric monitoring components within the same device – including a GSR meter circuit, blood pressure gauge, heart rate sensor, and more.
Typically, the output drives a chart recorder for subsequent analysis.
Lie detection is effective when addressing neutral subjects.
However, employing it to probe into personal matters can yield misleading results, as various factors can trigger responses.
It's wise to refrain from posing personal questions to individuals connected to the GSR monitor circuit, as this could lead to unnecessary discomfort.
An engaging activity involves asking someone to select a card from a set of ten (using more cards will extend the test excessively) and memorize it.
Proceed to display the cards individually while inquiring, 'Is this the card you chose?' The person must consistently respond with 'No, it isn't.'
When the chosen card emerges, the response will be a lie, causing the meter needle to swing leftward.
This helps identify the selected card.
Allow a sufficient interval between cards for the meter needle to return to its central position; slight movements might occur after each response.
Biofeedback can enhance the results. If the monitor's user can observe the needle's movement, the deflection should be more pronounced compared to cases where visibility is limited.
Alternatively, a crafty approach involves providing false biofeedback – making the subject believe they're witnessing their responses being measured, while in reality, they're observing a meter under your control (for instance, a multimeter set to the ohms range connected to an adjustable resistor).
Ask questions, and if untruthful answers surface, adjust the resistor to generate a significant needle swing. This should amplify the authentic GSR response.
Outsmarting the lie detector is relatively simple, given the numerous ways to deliberately trigger a GSR response.
Conversely, attempting to suppress your GSR reaction to a lie proves more challenging, but relaxation techniques can provide assistance in this endeavor.
Hello Swagatam,
Thank you so much for posting this! I am very much interested in GSR as a way to control an electronic musical instrument such as drone oscillator or group of of oscillators. I’ve been experimenting with using a cd40106 with touch plates to control pitch but very much like the idea of something more sensitive like GSR that can output a CV voltage to control something like a filter, envelope or VCO pitch.
I think of this as sort of a meditation tool. For example let’s say I have a drone box playing some tones but I am connected to the filter on it via a GSR interface that puts up to +5v or +5/-5v and as I relax the filter either opens or closes.
I assembled first part your circuit on a breadboard and got some really interesting sounds and had some measure of control. I also replaced r1-r3 with potentiometers to try out different values.
Do you have any thoughts on how to build a circuit that can take the GSR input and output a usable and attenuable CV? I would be very grateful for any insights. It seems like even the output on your current design could just be amplified to control a vco maybe I’m not thinking of this correctly.
Also is the circuit board layout that you did available to download so I might print one on pcbway?
Many thanks for your insight and contributions on here. I am just getting started and learning about this kind of stuff. I am also really I’m thankful for your capacitive touch schematics in your other article too. I have another idea for an instrument that could use some extremely sensitive capacitive touch sensors that can be activated from a distance. 🙂
Thank you Reilly,
I am so glad you liked the above concept and could get interesting results from the first design.
Honestly, I am not good with audio circuits, and the above article was actually contributed by an external author.
Therefore it can be difficult for me suggest the precise way of interfacing the above GSR with a VCO and the drone oscillator.
However i have some useful VCO designs which you can refer to below, and try connecting the output of the GSR with the input of the VCO, although I am not sure where the drone output could be adjusted here.
https://www.homemade-circuits.com/voltage-controlled-oscillator-circuit/
And for the capacitive response you can also consider trying the following theremin concept.
https://www.homemade-circuits.com/digital-theremin-circuit-make-music-with-your-hands/
Unfortunately the PCB design is not downloadable but can be saved in your computer.
The saved design can be used for replicating it on any PCB design software.
Please let me know if you have any further doubts or queries.
Thank you so much for your help!