

In this post I will elaborately explain how Cathode Ray Oscilloscopes (CRO) work and its internal construction. We will also learn how to use a CRO using the various controls and understand the graphical representations of the various input signals on the display screen of the scope.
Importance of Cathode Ray Oscilloscopes (CRO)
We know that majority of the electronic circuits strictly involve and work using electronic waveform or digital waveform, which are normally produced as a frequency. These signals play an important part in such circuits in the form of audio information, computer data, TV signals, oscillators and timing generators (as applied in radars) etc. Therefore measuring these parameters accurately and correctly becomes very crucial while testing and troubleshooting these types of circuits
The commonly available meters such as digital multimeters or analogue multimeters have limited facilities and are able to measure dc or ac voltages, currents or impedances only. Some advanced meters are able to measure ac signals but only if the signal is highly refined and in the form of specific undistorted sinusoidal signals. Hence these meters fail to serve the purpose when it comes to analyzing circuits involving waveform and timed cycles.
In contrast an oscilloscope is a device which are designed for accepting and measuring waveform accurately enabling the user to visualize the shape of the pulse or the waveform practically.
The CRO is one of those high grade oscilloscopes which allows the user to see a visual representation of an applied waveform in question.
It employs a cathode ray tube (CRT) for generating the visual display corresponding to the signal applied at the input as a waveform.
The electron beam inside the CRT goes through deflected movements (sweeps) across the face of the tube (screen) in response to the input signals, creating a visual trace on the screen representing the waveform shape. These continuous traces then allows the user to examine the waveform and test its characteristics.
The feature of an oscilloscope to produce the actual image of the waveform becomes very helpful compared to digital multimeters which are only able to provide numerical values of the waveform.
As we all know cathode ray oscilloscopes work with electron beams for indicating the various readings on the oscilloscope screen. For deflecting or processing the beam horizontally an operation called sweep-voltage is incorporated, while the vertical processing is done by the input voltage which is being measured.
CATHODE RAY TUBE — THEORY AND INTERNAL CONSTRUCTION
Inside a cathode ray oscilloscope (CRO), the Cathode Ray Tube (CRT) becomes the main component of the device. The CRT becomes responsible for generating the complex waveform imaging on the screen of the scope.
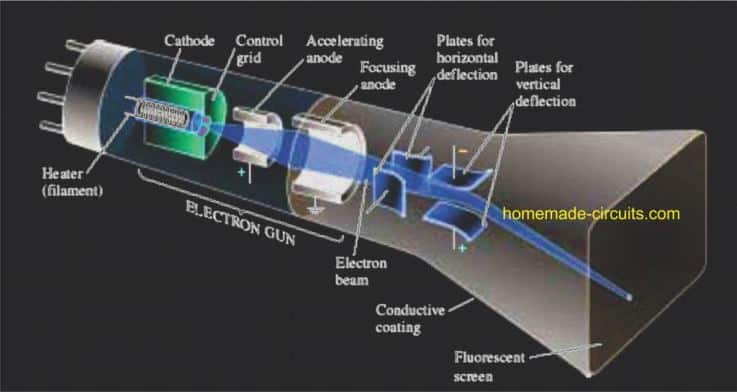
The CRT basically comprises of four parts:
1. An electron gun for generating the electron beam.
2. Focusing and accelerating components for creating accurate beam of electrons.
3. Horizontal and vertical deflecting plates for manipulating the angle of the electron beam.
4. An evacuated glass enclosure coated with phosphorescent screen for creating the required visible glow in response to the striking of the electron beam on its surface
The following figure presents the basic construction details of a CRT

Now I have explained how the CRT works with its basic functions.
How Cathode Ray Oscilloscope (CRO) Work
A hot filament inside the CRT is used for heating the cathode (K) side of the tube consisting of an oxide coating. This results in an instant release of electrons from the cathode surface.
An element called the control grid (G) controls the quantity of electrons which can pass farther across the tube length. The level of voltage applied on the grid determines the quantity of electrons are freed from the heated cathode, and how many of them are allowed to move ahead towards the face of the tube.
Once the electrons surpass the control grid, they go through subsequent focusing into a sharp beam and a high speed acceleration with the help of anode acceleration.
This highly accelerated electron beam in the next phase is passed between a couple of sets of deflection plates. The angle or the orientation of the first plate is held in such a way that it deflects the electron beam vertically up or down. This in turn is controlled by the voltage polarity applied across these plates.
Also by how much the deflection on the beam is allowed is determined by the amount of voltage applied on the plates.
This controlled deflected beam then goes through more acceleration through extremely high voltages applied on the tube, which finally causes the beam to hit the phosphorescent layer coating of the inside surface of the tube.
This instantly causes the phosphor to glow in response to the striking of the electron beam generating the visible glow on the screen for the user handling the scope.
The CRT is an independent complete unit having appropriate terminals protruded out via a rear base into specific pinouts.
Different forms of CRTs are available in the market in many different dimensions, with distinct phosphor coated tubes and deflection electrode positioning.
Let's now give some thought to the way the CRT is employed in an oscilloscope.
The waveform patterns that we visualize for a given sample signal is executed in this way:
As the sweep voltage moves the electron beam horizontally on the inner face of the CRT screen, the input signal which is being measured simultaneously forces the beam to deflect vertically, generating the required pattern on the screen graph for our analysis.
What is a Single Sweep
Every sweep of the electron beam on the CRT screen is followed with a fractional "blank" interval of time. During this blank phase the beam is briefly switched OFF until it reaches to the start point or the previous extreme side of the screen. This cycle of each sweep is called "one sweep of the beam"
To obtain a stable waveform display on the screen the electron beam is supposed to be "sweeped" repeatedly from left to right and vice versa using an identical imaging for each sweep.
To achieve this, an operation called synchronization becomes necessary, which ensures that the beam returns and repeats each sweep from exactly the same point on the screen.
When correctly synchronized, the waveform pattern on the screen appears stable and constant. However if the syncing is not applied, the waveform appears to be slowly drifting horizontally from one end of the screen toward the other end continuously.
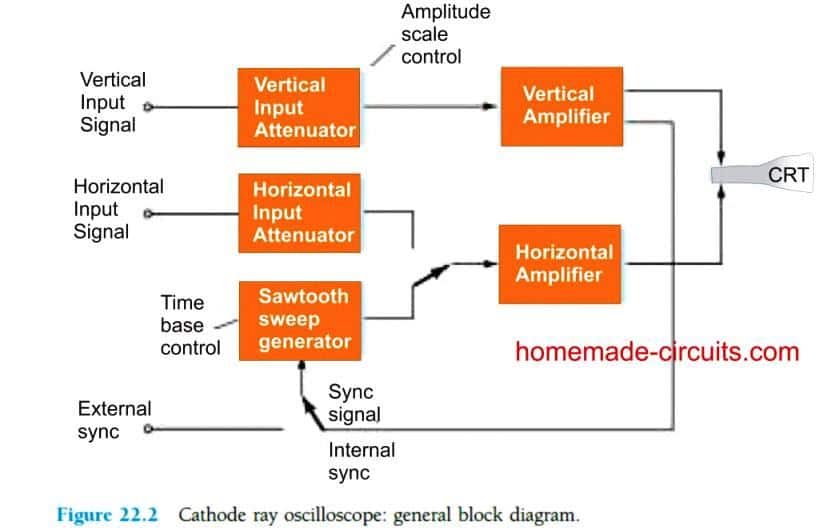
Basic CRO Components
The essential elements of a CRO can be witnessed in Fig. 22.2 below. We are going to primarily analyze the CRO’s operational details for this basic block diagram.
For achieving a meaningful and recognizable deflection of beam through at least a centimeter to some centimeters, the typical level of voltage utilized on the deflection plates has to be minimum at tens or even hundreds of volts.
Due to the fact that the pulses assessed through a CRO usually at only a few volts in magnitude, or at the most at several millivolts, suitable amplifier circuits become necessary to boost the input signal upto the optimal voltage levels necessary to run the tube.
In fact, amplifier stages are employed which help to deflect the beam on both the horizontal and the vertical planes.
To be able to adapt the input signal level which is being analyzed, each input pulse has to proceed through an attenuator circuit stage, designed to enhance the amplitude of the display.

VOLTAGE SWEEP OPERATION
The voltage sweep operation is implemented in the following manner:
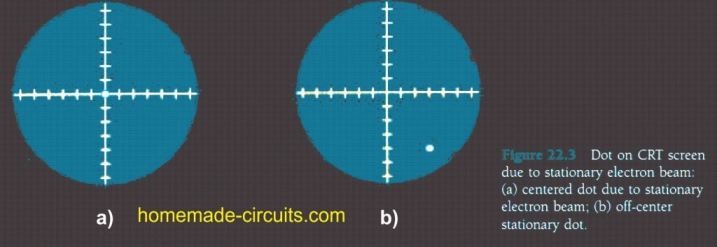
In situations when the vertical input is held at 0V, the electron beam is supposed to be seen at the vertical center of the screen. If a 0V is identically applied to the horizontal input, the beam is positioned at the center of the screen appearing like a solid and stationery DOT at the center.
Now, this "dot" could be moved anywhere across the screen face, simply by manipulating the horizontal and the vertical control buttons of the oscilloscope.
The position of the dot can be also changed through a specific dc voltage introduced at the input of the oscilloscope.
The following figure shows how exactly the the position of the dot could be controlled through on a CRT screen through a positive horizontal voltage (towards right) and a negative vertical input voltage (downwards from the center).

Horizontal Sweep Signal
For a signal to become visible on the CRT display, it becomes imperative to enable a beam deflection through a horizontal sweep across the screen, such that any corresponding vertical signal input allows the change to be reflected on the screen.
From Fig 22.4 below we can visualize the straight line on the display obtained due to a positive voltage feed to the vertical input through a linear (sawtooth) sweep signal applied to the horizontal channel.

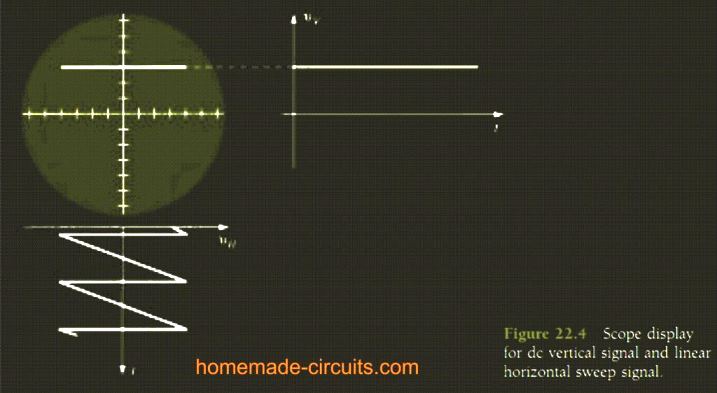
When the electron beam is held over a selected fixed vertical distance, the horizontal voltage is forced to travel from negative to zero to positive, causing the beam to travel from left side of the screen, to the center, and to the right side of the screen. This movement of the electron beam generates a straight line above the center vertical reference, displaying an appropriate dc voltage in the form of a starlight line.
Instead of producing a single sweep, the sweep voltage is implemented to work like a continuous waveform. This is essentially to ensure a consistent display to be visible on the screen. If just a single sweep is used, it wouldn't last and would fade out instantly.
That's why repeated sweeps are generated per second inside the CRT which gives an appearance of a continuous waveform on the screen due to our persistence of vision.
If we reduce the above sweep rate depending on the time-scale provided on the oscilloscope, the real moving impression of the beam could be witnessed on the screen. If only a sinusoidal signal is applied to the vertical input without the presence of the horizontal sweep, we would see a vertical straight line as depicted in Fig 22.5.

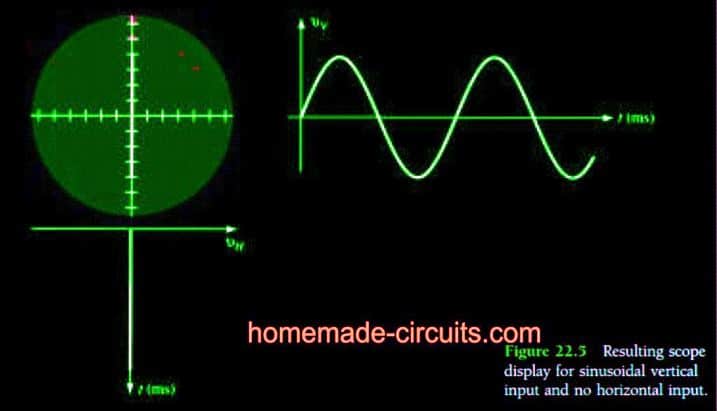
And if the speed of this sinusoidal vertical input is sufficiently reduced enables us to see the electron beam travelling up down along the path of a straight line.
Using Linear Sawtooth Sweep to Display Vertical Input
If you are interested to examine a sine wave signal, you will have to utilize a sweep signal on the horizontal channel. This will allow the signal applied on the vertical channel to become visible on the screen of the CRO.
A practical example can be seen in Fig. 22.6 which shows a waveform generated by utilizing a horizontal linear sweep along with a sinusoidal or sine input through the vertical channel.

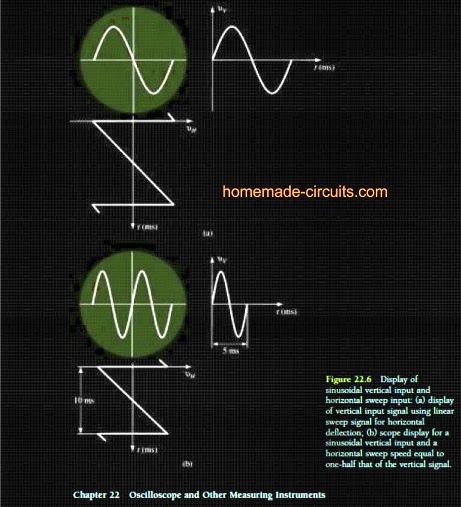
In order to obtain a single cycle on the screen for the applied input, a synchronization of the input signal and the linear sweep frequencies becomes essential. Even with a minute difference or incorrect syncing the display may fail to show any movement.
If the sweep frequency is reduced, more number of cycles of the sine input signal could be made visible on the CRO screen.
On the other hand, if we increase the frequency of the sweep would allow lower number of vertical input sine signal cycles to be visible on the display screen. This would in fact result in generating a magnified portion of the applied input signal on the CRO screen.
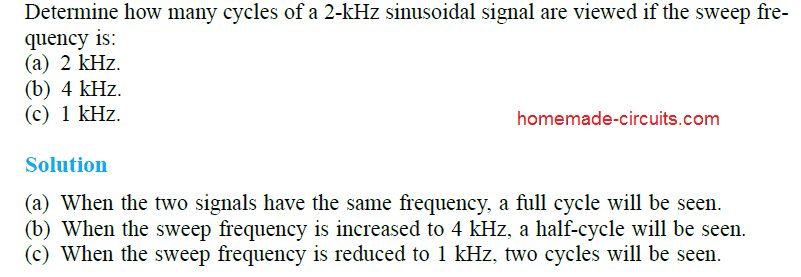
Solved Practical Example:

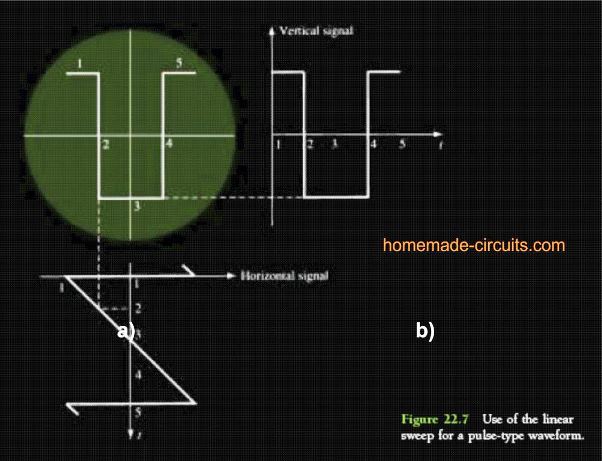
In Fig.22.7 we can see the oscilloscope screen displaying a pulsed signal in response to a pulse like waveform applied to the vertical input with a horizontal sweep
The numbering for each waveform enables the display to follow the variations of the input signal and the sweep voltage for each cycle.

SYNCHRONIZATION AND TRIGGERING
Adjustments in Cathode Ray Oscilloscope is executed by adjusting the speed in terms of frequency, for producing a single cycle of a pulse, many number of cycles, or a portion of a waveform cycle, and this feature becomes one of the CRO is a crucial features of any CRO.
In Fig.22.8 we can see the CRO screen displaying a response for a few number of cycles of the sweep signal.
For each execution of horizontal sawtooth sweep voltage via a linear sweep cycle (having a limit from maximum negative limit of zero to maximum positive), causes the electron beam to travel horizontally across the CRO screen area, starting from left, to center, and then to right of the screen.

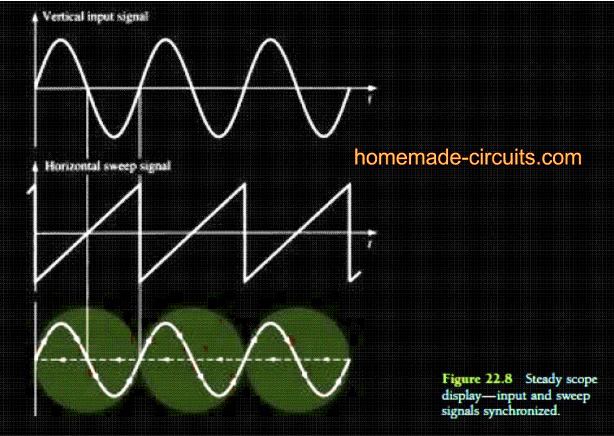
After this the sawtooth voltage returns quickly back to the starting negative voltage limit with the electron beam correspondingly moving to the left side of the screen. During this period of time when the sweep voltage undergoes a swift return to the negative (retrace), the electron goes through a blank phase (wherein the grid voltage inhibits the electrons from striking the face of the tube)
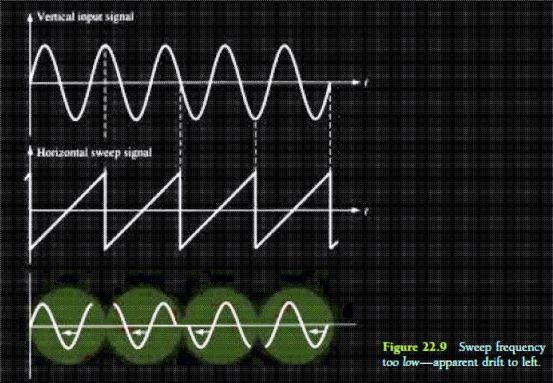
For enabling the display to produce a stable signal image for every sweep of the beam, it becomes essential to initiate the sweep from the exact same point in the input signal cycle.
In Fig.22.9 we can see that a rather low sweep frequency causing the display to produce an appearance of a left side drift of the beam.

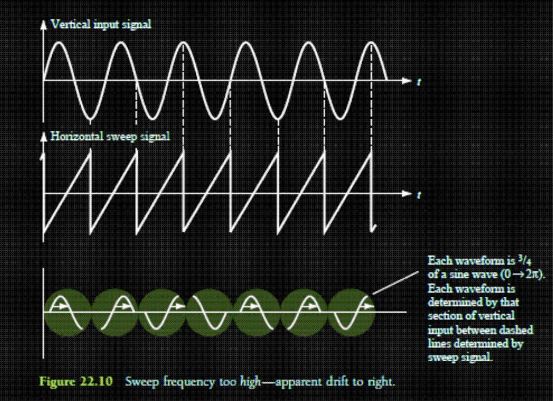
When set to a high sweep frequency as proven in Figure 22.10, the display produces a appearance of a right side drift of the beam on the screen.

Needless to say, it can be very difficult or impracticable to adjust the sweep signal frequency exactly equal to the input signal frequency for achieving a steady or constant sweep on the screen.
A more feasible looking solution is to wait for the signal to return back to the starting point of the trace in a cycle. This type of triggering includes some good features which we'll discuss in the following paragraphs.
Triggering
The standard approach for the synchronization employs a small portion of the input signal for switching the sweep generator, which forces the sweep signal to latch or lock in with the input signal, and this process synchronizes the two signals together.
In Fig 22.11 we are able to see the block diagram illustrating the extraction of a portion of the input signal in a single channel oscilloscope.
This trigger signal is extracted from the mains AC line frequency (50 or 60Hz) for analyzing any external signals which may be associated or concerned with the AC mains, or may be a related signal applied as a vertical input in the CRO.

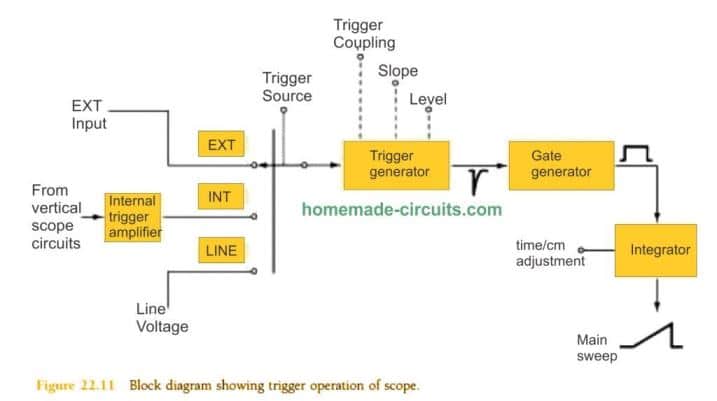
When the selector switch is toggled towards the "INTERNAL" enables a portion of the input signal to be used by the trigger generator circuit. Then, the output trigger generator output is used to initiate or start the main sweep of the CRO, which remains visible for a period as set by the time/cm control of the scope.
The initialization of the triggering at several different points across a signal cycle can be visualized in Fig. 22.12. The functioning of the trigger sweep could be also analyzed through the resultant waveform patterns.

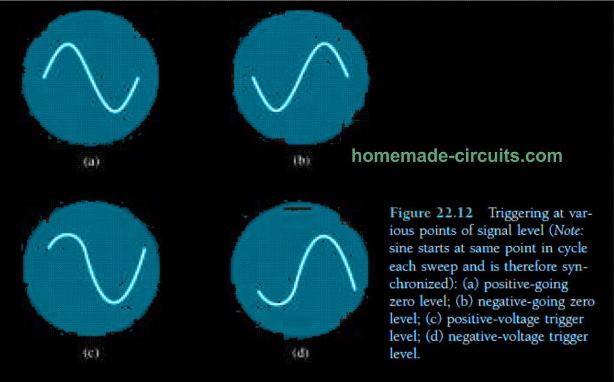
The signal which is applied as the input is used for generating a trigger waveform for the sweep signal. As shown in the Fig 22.13, the sweep is initiated with the input signal cycle and it sustains for a period decided by the sweep length control setting. Subsequently, the CRO operation waits until the input signal attains an identical point in its cycle before initiating a new sweep operation.

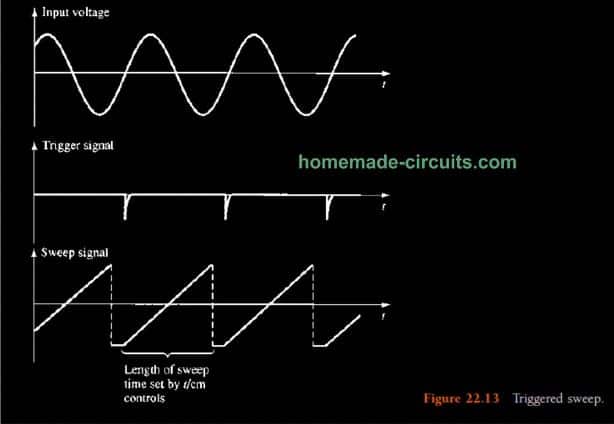
The above explained triggering method enables the synchronization process, while the number of cycles that can be viewed on the display is determined by the length of the sweep signal.
MULTITRACE FUNCTION
Many of the advanced CROs facilitate viewing of more than one, or multiple traces on the display screen simultaneously, which allows the user to easily compare the special or other specific characteristics of multiple waveforms.
This feature is normally implemented using multiple beams from multiple electron guns, which generate individual beam on the CRO screen, however sometimes this is also executed through a single electron beam.
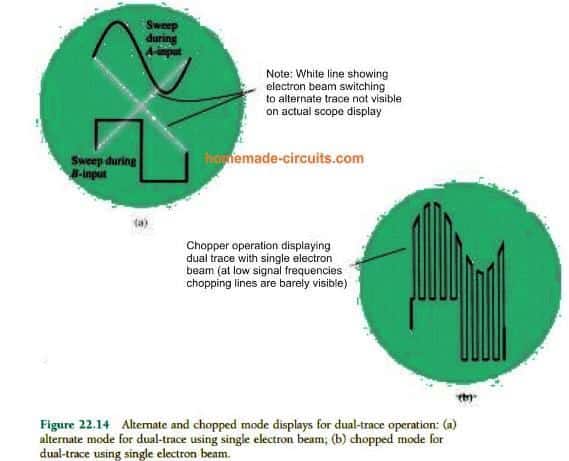
There are a couple of techniques that are employed for generating multiple traces: ALTERNATE and CHOPPED. In the alternate mode the two signals available at the input, are alternately connected to the deflection circuit stage through an electronic switch. In this mode beam is swept across the CRO screen no matter how many traces are to be displayed. After this, the electronic switch alternatively picks the second signal and does the same for this signal too.
This mode of operation can be witnessed in Fig. 22.14a.
Fig 22.14b demonstrates the CHOPPED mode of operation wherein the beam goes through a repetitive switching for selecting between the two input signals for every sweep signal of the beam. This switching or chopping action stays undetectable for relatively lower frequencies of the signal, and is apparently seen as two individual traces on the CRO screen.

How to Measure Waveform through Calibrated CRO scales
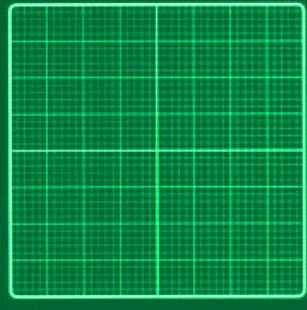
You might have seen that the screen of the CRO display consists of clearly marked calibrated scale. This is provided for the measurements of amplitudes and time factor for an applied waveform in question.
The marked units are visible as boxes which are divided through 4 centimeters (cm) on either sides of the boxes. Each of these boxes are additionally divided into intervals of 0.2 cm.

Measuring Amplitudes:
The vertical scale on the screen of the RO can be seen calibrated in either volts/cm (V/cm) or millivolts/cm (mV/cm).
With the help of the settings of the control buttons of the scope, and the markings presented on the face of the display, the user is able to measure or analyze the peak-to-peak amplitudes of a waveform signal or typically an AC signal.
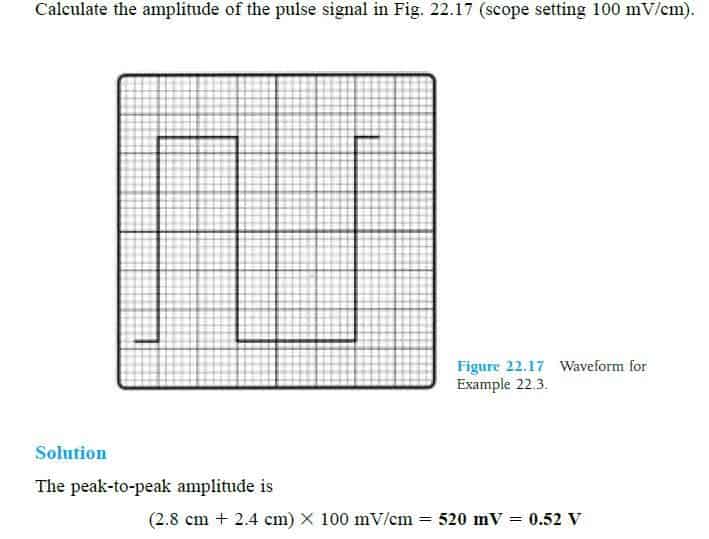
Here's a practical solved example for understanding how amplitude is measured on the screen of the CRO:

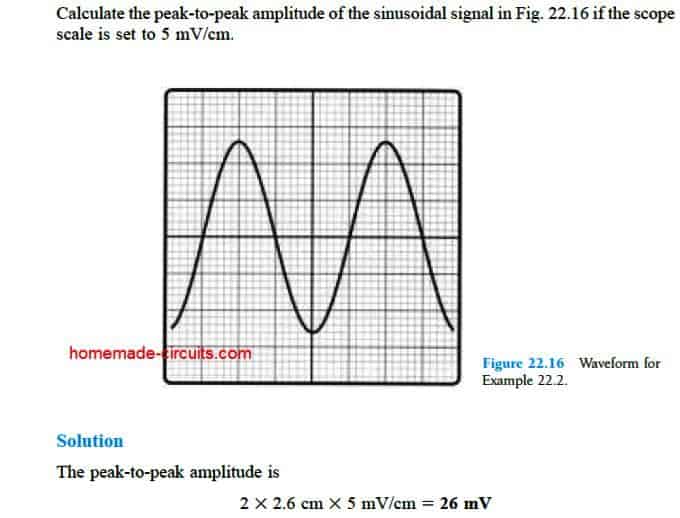
Note: This is the advantage of a oscilloscope against multimeters, since multimeters only provide the RMS value of the AC signal, while a scope is able to provide both the value of RMS as well as the peak-to-peak value of the signal.

Measuring Timing (Period) of an AC cycle using Oscilloscope
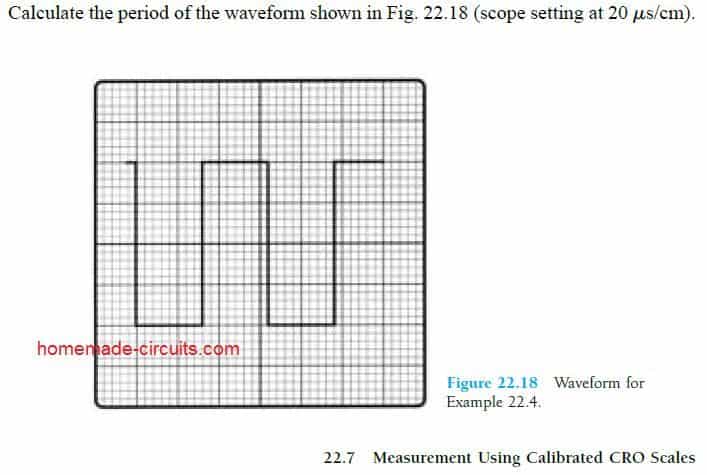
The horizontal scale provided on the screen of an oscilloscope helps us to determine the timing of an input cycle in seconds, in milliseconds (ms), and in microseconds (μs), or even in nanoseconds (ns).
The time interval consumed by a pulse to complete a cycle from start to end is called the period of the pulse. When this pulse is in the form of a repetitive waveform, its period is called one cycle of the waveform.
Here's a practical solved example showing how to determine period of a waveform using CRO screen calibration:


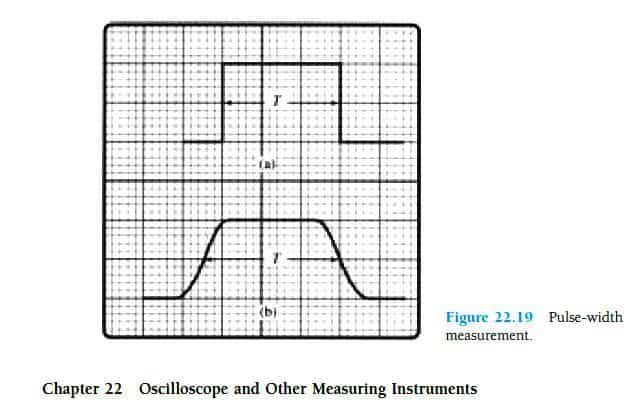
Measuring Pulse Width
Every waveform is made up of maximum and minimum voltage peaks called as high and low states of the pulse. The time interval for which the pulse remains at its HIGH or LOW states is called the pulse width.
For pulses whose edges rise and decline very sharply (rapidly), the width of such pulses are measured from the start of the pulse called the leading edge upto the end of the pulse called the trailing edge, this is exhibited in Fig. 22.19a.
For pulses which have rather slower or sluggish rise and fall cycles (exponential type) , their pulse width is measured across their 50% levels in the cycles, as indicated in Fig. 22.19b.

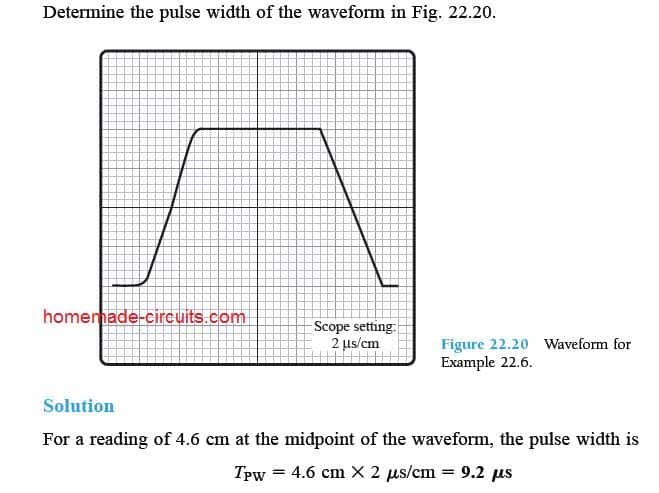
The following solved example helps to understand the above procedure in a better way:

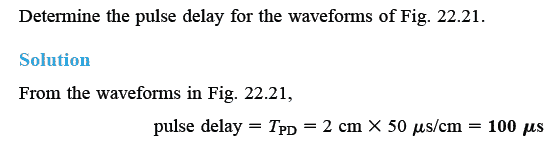
UNDERSTANDING PULSE DELAY
The time interval space between the pulses in a pulse cycle is called pulse delay. A pulse delay example can be seen in the below given figure 22.21, we can see the delay here is measured between the middle point or the 50% level and the start point of the pulse.

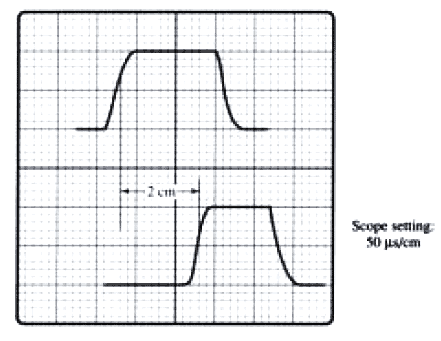
Figure 22.21
Practical solved example showing how to measure pulse delay in CRO

Conclusion:
I have tried to include most of the basic details regarding how Cathode Ray Oscilloscope (CRO) work , and have tried to explain how to use this device for measuring various frequency based signals through its calibrated screen. However there can be still many more aspects that I might have missed here, nonetheless I'll keep checking from time to time and update more info whenever it is possible.
Reference: https://en.wikipedia.org/wiki/Oscilloscope